What are the differences between
raster-scan CRTs and random-access or vector CRTs? [4]
Raster-scan system:-
1)raster
displays have less resolution.
2)the lines produced are zig-zag as the plotted values are discrete.
3)high degree realism is achieved in picture with the aid of advanced shading and hidden surface technique.
4)decreasing memory costs have made raster systems popular.
2)the lines produced are zig-zag as the plotted values are discrete.
3)high degree realism is achieved in picture with the aid of advanced shading and hidden surface technique.
4)decreasing memory costs have made raster systems popular.
Random scan system:-
1)random
displays have high resolutions since the picture defination is stored as a set
of line drawing commands and not as a set of intensity values.
2)smooth lines are produced as the electron beam directly follows the line path.
3)realism is difficult to achieve.
4)random-scan system's are generally costlier.
a) Explain why RGB color model is used for display. How different shades of colors are generated on the RGB monitors. [6]
2)smooth lines are produced as the electron beam directly follows the line path.
3)realism is difficult to achieve.
4)random-scan system's are generally costlier.
a) Explain why RGB color model is used for display. How different shades of colors are generated on the RGB monitors. [6]
The RGB
color model creates colors by mixing light, red, green and blue. All video
displays are RGB. Since it is impossible to print a light mixture printers are
able to simulate full color by using four colors, cyan, magenta, yellow and
black. Most new color laser copy machines automatically convert RGB to CMYK
when a digital file is sent, but the results may be off color.
1. e) Explain how colour images are displayed on a computer monitor. [4]
1. e) Explain how colour images are displayed on a computer monitor. [4]
2.3 CRTs for Color Display
This was one the earlier CRTs to produce color
displays. Coating phosphors of different compounds can produce different
colored pictures. But the basic problem of graphics is not to produce a picture
of a predetermined color, but to produce color pictures, with the color
characteristics chosen at run time. The basic principle behind colored displays
is that combining the 3 basic colors –Red, Blue and Green, can produce every
color. By choosing different ratios of these three colors we can produce
different colors – millions of them in-fact. We also have basic phosphors,
which can produce these basic colors. So, one should have a technology to
combine them in different combinations.
2.4 Beam Penetration CRT
This CRT is similar to the simple CRT, but it
makes use of multi coloured phosphorus of number of layers. Each phosphorus
layer is responsible for one colour. All other arrangements are similar to
simple CRT. It can produce a maximum of 4 to 5 colours The organization is
something like this - The red, green and blue phosphorus are coated in layers -
one behind the other. If a low speed beam strikes the CRT, only the red colored
phosphorus is activated, a slightly accelerated beam would activate both red
and green (because it can penetrate deeper) and a much more activated one would
add the blue component also. But the basic problem is a reliable technology to
accelerate the electronic beam to precise levels to get the exact colors - it
is easier said than done. However, a limited range of colors can be
conveniently produced using the concept.
c) Explain
shadow masking method for colour monitor.
[4]
The shadow mask CRT, instead of using one
electron gun, uses 3 different guns placed one by the side of the other to form
a triangle or a "Delta" as shown. Each pixel point on the screen is
also made up of 3 types of phosphors to produce red, blue and green colors.
Just before the phosphor screen is a metal screen, called a "shadow
mask". This plate has holes placed strategically,
so that when the beams from the three electron guns are focused on a particular
pixel, they get focused on particular color producing pixel only i.e. If for
convenience sake we can call the electronic beams as red, blue and green beams (though in practice the colors are
produced by the phosphors, and until the beams hit the phosphor dots, they
produce no colors), the metal holes focus the red beam onto the red color
producing phosphor, blue beam on the blue producing one etc. When focused on to
a different pixel, the red beam again focuses on to the red phosphor and so on.
Now, unlike the beam penetration CRTs where the acceleration of the electron
beam was being monitored, we now manipulate the intensity of the 3 beams
simultaneously. If the red beam is made more intense, we get more of red color
in the final combination etc. Since fine-tuning of the beam intensities is
comparatively simple, we can get much more combination of colors than the beam
penetration case. In fact, one can have a matrix of combinations to produce a
wide variety of colors. The shadow mask CRT, though better than the beam
penetration CRT in performance, is not without it's disadvantages. Since three
beams are to be focused, the role of the "Shadow mask" becomes
critical. If the focusing is not achieved properly, the results tend to be
poor. Also, since instead of one pixel point in a monochrome CRT now each pixel
is made up of 3 points (for 3 colors), the resolution
a) Describe construction of a typical
cathode ray tube for monitor.
[4]
2.2 The Cathode Ray Tube (CRT/Monitor)
One of the basic and commonly used display
devices is Cathode Ray Tube (CRT). A cathode ray tube is based on the simple concept
that an electronic beam, when hits a phosphorescent surface, produces a beam of
light
(momentarily - though we later describe
surfaces that produce light intensities lashing over a period of time).
Further, the beam of light itself can be focused to

any point on the screen by using suitable
electronic / magnetic fields. The direction and intensity of the fields will
allow one to determine the extent of the defection
of the beam. Further these electronic / magnetic fields can be easily manipulated
by using suitable electric fields with this background. In following section we
describe the structure and working of the simple CRT.
Simple CRT makes use of a conical glass tube.
At the narrow end of the glass tube an electronic gun is kept. This gun generates
electrons that will be made to pass through the magnetic system called yoke.
This magnetic
system is used for making the electronic beam
to fall throughout the broad surface of the glass tube. The broad surface of
the glass tube contains a single coat of high quality phosphorus. This reflects
the electronic beam makes it to fall on the computer screen.
A pair of focusing grids - one horizontal and
another vertical does the actual focusing of the electronic beam on to the
screen. Electronic or magnetic fields operate these grids. Depending on the
direction (positive or negative) and the intensity of the fields applied to
them, the beam is deflected horizontally (or vertically) and thus, by using a
suitable combination of these focusing grids; the beam can be focused to any
point on the screen.
So, we now have a mechanism wherein any point
on the screen can be illuminated (or made dark by simply switching off the
beam). Hence, from a graphics point of view, any picture can be traced on the
screen by the electron beam by suitably and continuously
manipulating the focusing grids and we get to
see the picture on the screen "A basic graphic picture" of course,
since the picture produced vanishes once the
beam is removed, to give the effect to
continuity, we have to keep the beam retracing the picture continuously -
(Refreshing).
Explain what is interlacing? [4]
Interlace is a technique of
improving the picture quality of a video signal
without consuming extra bandwidth. Interlaced video
was designed for display on CRT
televisions.
Interlaced scan refers to one of two common methods for
"painting" a video image on an electronic display screen (the other
being progressive scan) by
scanning or displaying each line or row of pixels. This technique uses two
fields to create a frame. One field contains all the odd lines in the image,
the other contains all the even lines of the image. A PAL based television
display, for example, scans 50 fields every second (25 odd and 25 even). The
two sets of 25 fields work together to create a full frame every 1/25th of a
second, resulting in a display of 25 frames per second.
To display interlaced video on modern progressive scan
displays, a complex process called deinterlacing should be
applied to the video signal or video data stored on a media.
a) What
are frame buffers? What are its applications? [4]
The frame-buffer display is now the most popular computer
output device, as a result of the rapid decline in the cost of high speed
semiconductor memories and the low cost of raster-scan displays. Frame buffers
are incorporated in a wide range of equipment, from home computers to
engineering workstations to flight simulators. All frame buffers have the same
principal role for every picture element on the screen, to record its intensity
or color and to refresh the display image continuously. However, the size,
structure and performance of frame buffers differ markedly for different
applications. A frame buffer display has strengths and weaknesses. Its
principal strength is that it can show an arbitrary image, subject only to the
limits of spatial and intensity resolution provided by the display. Because the
memory holds a separate digital value for each picture element, or pixel, on
the screen, arbitrary images can be displayed. A potential weakness of the
frame buffer is that a great many bits must be changed in order to make major
changes to the picture. Thus, a key concern in the design of frame buffer
displays is to provide high speed access to the memory for display updates. In
many applications, the frame buffer serves a second role, in addition to
refreshing the display. It records an image data structure.
e) Differentiate
between the two graphics standard GKS and PHIGS. [4]
GKS
is Graphical Kernel System. American National Standard ANSI X3.128-1985, which
standardizes basic graphics functionality, and PHIGS (Programmer's Hierarchical
Interactive Graphics System) is an API standard for rendering 3D computer
graphics.
GKS (Graphics Kernel System) is an international standard for the functional interface to 2D graphics, whilst PHIGS (Progammer's Hierarchical Interactive Graphics System) is currently an ISO work item for 2D and 3D graphics. The Graphical Kernel System (GKS) was the first ISO standard for low-level computer graphics, introduced in 1977. GKS provides a set of drawing features for two-dimensional vector graphics suitable for charting and similar duties. PHIGS (Programmer's Hierarchical Interactive Graphics System) is an API standard for rendering 3D computer graphics, at one time considered to be the 3D graphics standard for the 1990s.
GKS (Graphics Kernel System) is an international standard for the functional interface to 2D graphics, whilst PHIGS (Progammer's Hierarchical Interactive Graphics System) is currently an ISO work item for 2D and 3D graphics. The Graphical Kernel System (GKS) was the first ISO standard for low-level computer graphics, introduced in 1977. GKS provides a set of drawing features for two-dimensional vector graphics suitable for charting and similar duties. PHIGS (Programmer's Hierarchical Interactive Graphics System) is an API standard for rendering 3D computer graphics, at one time considered to be the 3D graphics standard for the 1990s.
2. Transformation and Projections
b) What are oblique projections? [4]
oblique projections
illustrate the general 3 dimensional shape of the object. However only faces of
the object parallel to the plane of projection are shown at there true size and
shape, that is angles and lengths are preserved for these faces only. In fact
,the oblique projection of these faces is equivalent to an orthographic front
view.
TYPES OF OBLIQUE
PROJECTIONS-
1.Cavalier 2.Cabinet
Cavalier Projection-A cavalier
projection is obtained when the angle between oblique projectors and the plane
of projection is 45 degree. In a cavalier projection the foreshortening factors
for all three principal direction are equal. The resulting figure appears too
thick. A cabinet projection is used to correct this deficiency.
Cabinet projection- An oblique
projection for which the foreshortening factor for edges perpendicular to the
plane of projection is one half is called a cabinet projection.
What
do understand by the term 3-point perspective projection? Explain with the help
of a diagram. [5]
Perspective (from Latin perspicere,
to see through) in the graphic arts, such as drawing, is an approximate
representation, on a flat surface (such as paper), of an image as it is seen by
the eye. The two most characteristic features of perspective are that objects
are drawn:Smaller as their distance from the observer increases
·
Foreshortened: the size
of an object's dimensions along the line of sight are relatively shorter than
dimensions across the line of sight (see later).
·
Of the many types of perspective drawings,
the most common categorizations of artificial perspective are one-, two- and
three-point. The names of these categories refer to the number of vanishing
points in the perspective drawing.
· One-point perspective

·
One-point perspective exists when the
painting plate (also known as the picture plane) is
parallel to two axes of a rectilinear (or Cartesian) scene — a scene which is
composed entirely of linear elements that intersect only at right angles. If
one axis is parallel with the picture plane, then all elements are either
parallel to the painting plate (either horizontally or vertically) or
perpendicular to it. All elements that are parallel to the painting plate are
drawn as parallel lines. All elements that are perpendicular to the painting
plate converge at a single point (a vanishing point) on the horizon.
·
Two-point perspective
·
Walls in 2-pt perspective.
Walls converge towards 2 vanishing points.
All vertical beams are parallel.
Model by "The Great One" from 3D Warehouse.
Rendered in SketchUp.
Walls converge towards 2 vanishing points.
All vertical beams are parallel.
Model by "The Great One" from 3D Warehouse.
Rendered in SketchUp.
·
Two-point perspective can be used to draw the
same objects as one-point perspective, rotated: looking at the corner of a house,
or looking at two forked roads shrink into the distance, for example. One point
represents one set of parallel lines, the other point represents the other.
Looking at a house from the corner, one wall would recede towards one vanishing
point, the other wall would recede towards the opposite vanishing point.
·
Two-point perspective exists when the
painting plate is parallel to a Cartesian scene in one axis (usually the
z-axis) but not to the other two axes. If the scene being viewed consists
solely of a cylinder sitting on a horizontal plane, no difference exists in the
image of the cylinder between a one-point and two-point perspective.
·
Two-point perspective has one set of lines
parallel to the picture plane and two sets oblique to it.Parallel lines oblique
to the picture plane converge to a vanishing point,which means that this set-up
will require two vanishing points.
·
Three-point
perspective
Rendered using IRender nXt.
·
Three-point perspective is usually used for
buildings seen from above (or below). In addition to the two vanishing points
from before, one for each wall, there is now one for how those walls recede
into the ground. This third vanishing point will be below the ground. Looking
up at a tall building is another common example of the third vanishing point.
This time the third vanishing point is high in space.
·
Three-point perspective exists when the
perspective is a view of a Cartesian scene where the picture plane is not
parallel to any of the scene's three axes. Each of the three vanishing points
corresponds with one of the three axes of the scene. Image constructed using multiple vanishing
points.
·
One-point, two-point, and three-point
perspectives appear to embody different forms of calculated perspective. The
methods required to generate these perspectives by hand are different. Mathematically,
however, all three are identical: The difference is simply in the relative
orientation of the rectilinear scene to the viewer.
·
[edit] Four-point perspective
·
Four point perspective, also called
infinite-point perspective, is the curvilinear variant of two-point
perspective. As the result when made into an infinite point version (i.e. when
the amount of vanishing points exceeds the minimum amount required), a four
point perspective image becomes a panorama that can go to a 360 degree view and
beyond - when going beyond the 360 degree view the artist might depict an
"impossible" room as the artist might depict something new when it's
supposed to show part of what already exists within those 360 degrees. This
elongated frame can be used both horizontally and vertically and when used
vertically can be described as an image that depicts both a worms and birds eye
view of a scene at the same time.
·
As all other foreshortened variants of
perspective (respectively one- to six-point perspective), it starts off with a
horizon line, followed by four equally spaced vanishing points to delineate
four vertical lines created in a 90 degree relation to the horizon line.
·
The vanishing points made to create the
curvilinear orthogonals are thus made ad hoc on the four vertical lines placed
on the opposite side of the horizon line. The only dimension not foreshortened
in this type of perspective being the rectilinear and parallell lines at a 90
degree angle to the horizon line - similar to the vertical lines used in
two-point perspective.
·
[edit] Zero-point perspective
·
Because vanishing points exist only when
parallel lines are present in the scene, a perspective without any vanishing
points ("zero-point" perspective) occurs if the viewer is observing a
nonlinear scene. The most common example of a nonlinear scene is a natural
scene (e.g., a mountain range) which frequently does not contain any parallel
lines. A perspective without vanishing points can still create a sense of "depth,"
as is clearly apparent in a photograph of a mountain range (more distant
mountains have smaller scale features).
1. d) Explain one vanishing point projection from a point on z-axis. [4]
A vanishing point is
a point in a perspective drawing to which parallel lines not parallel to the
image plane appear to converge. The number and placement of the vanishing
points determines which perspective technique is being used. The concept was
first used by Renaissance artists such as Donatello, Masaccio and Leonardo da
Vinci.
linear perspective is
a drawing with 1-3 vanishing points.
curvilinear
perspective is a drawing with either 4 or 5 vanishing points, in 5 point
perspective the vanishing points are mapped into a circle with 4 vanishing points
at the cardinal headings N,W,S,E and one at the circle origin.
reverse perspective
is a drawing with vanishing points that are placed outside the painting with
the illusion that they are "in front of" the painting.
Vanishing points can
also refer to the point in the distance where the two verges of a road appear
to converge. This is often used to help assess the upcoming curves in the road;
to judge the radius and therefore the entry speed and optimum line. If the
vanishing point moves towards you or to your sides, the curve is tightening. If
the vanishing point moves away from you or comes to center, the curve is
straightening
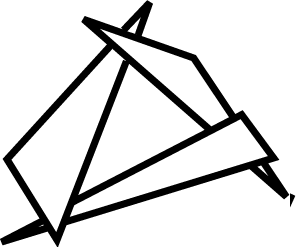
Vanishing Points
Any set of parallel lines that are not
parallel to the projection plane will converge to a vanishing point.If the set
of lines is parallel to one of the three principal axis then it is called a
principal vanishing point.
In this image the X and Y lines are parallel to the Z axis.
Since the projection plane is normal to the Z axis there is only one
principal vanishing point. Lines parallel to either X or Y axis are parallel
to projection planeand have no vanishing point. So it is a one-point
projection.
|
 |
In this image the lines are not parallel to the z axis. Since
the projection plane is normal to the z axis there is only one principal
vanishing point. Lines parallel to either x or y axis are parallel to
projection planeand have no vanishing point. So it is a one-point projection.
|
 |
b) How are points at Infinity represented
In homogenous coordinate system? [4]
Ideal Points or Points at Infinity
As
mentioned at the very beginning of this page, homogeneous coordinates can
easily capture the concept of infinity. Let a point (x,y) be
fixed and converted to a homogeneous coordinate by multiplying with 1/w,
(x/w,y/w,1/w). Let the value of w approach to zero,
then (x/w,y/w) moves farther and farther away in the direction of
(x,y). When w becomes zero, (x/w,y/w) moves
to infinity. Therefore, we would say, the homogeneous coordinate (x,y,0)
is the ideal point or point at infinity in the direction of (x,y).
Let us take a look at an example. Let (3,5) be a point in
the xy-plane. Consider (3/w,5/w). If w is not zero,
this point lies on the line y = (5/3) x. Or, if you like the
vector form, (3/w,5/w) is a point on the line O + (1/w)d,
where the base point O is the coordinate origin and d is the
direction vector <3>. Therefore, as w approaches zero, the point
moves to infinity on the line. This is why we say (x,y,0) is the
ideal point or the point at infinity in the direction of (x,y).
The story is the same for points in space, where (x,y,z,0)
is the ideal point or point at infinity in the direction of (x,y,z).
The concept of homogeneous coordinates and points at
infinity in certain direction will become very important when we discuss
representations of curves and surface.

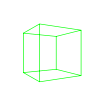
ISOMETRIC
PROJECTION Isometric projection is
the most frequently used type of axonometric
projection, which is a method used to show an object in
all three dimensions in a single view. Axonometric
projection is a form of orthographic projection in
which the projectors are always
perpendicular to the plane of projection.
However, the object itself, rather than the projectors,
are at an angle to the plane of projection. Figure 3-6 shows a cube projected
by isometric projection. The cube is
angled so that all of its surfaces make the same angle
with the plane of projection. As a result, the length
of each of the edges shown in the projection is
somewhat shorter than the actual length
of the edge on the object itself. This reduction
is called foreshortening. Since all
of the surfaces make the angle with the plane of projection, the edges foreshorten in the same ratio. Therefore, one scale can be used for the entire layout; hence, the term isometric which literally means the same
scale. VIEWS The
following pages will help you understand the types of
views commonly used in blueprints. MULTIVIEW
DRAWINGS The complexity of the shape of a
drawing governs the number of views needed to project
the drawing. Complex drawings normally have six views:
both ends, front, top, rear, and bottom. However, most
drawings are less complex and are shown in three views.
This is simply a way of projecting the third dimension
from a flat 2 dimensional drawing - easy enough to do with simple shapes but
not very convincing where other shapes are concerned. It varies from true
perspective in that the lines don't converge at vanishing points.
Isometric projection
is a form of graphical
projection — more specifically, an axonometric
projection. It is a method of visually
representing three-dimensional objects in two dimensions, in which the three coordinate axes appear
equally foreshortened and the angles between any two of them are 120°.
Isometric projection is one of the projections used in drafting
engineering
drawings.
The term isometric comes
from the Greek
for "equal measure", reflecting that the scale
along each axis of the projection is the same (this is not true of some other
forms of graphical projection).
One of the advantages of isometric
perspective in engineering drawings is that 60° angles are easy to construct
using only a compass and straightedge.
You can create realistic visual
effects in a drawing by defining either parallel or perspective projections of
a model.
The
difference between perspective views and parallel projections is that
perspective views require a distance between a theoretical camera and target
point. Small distances produce severe perspective effects; large distances
produce mild effects.
Parallel Projection
Parallel projection is just a cheap imitation of what the real world
would look like. This is because it simply ignores the z extent of all points.
It is just concerned with the easiest way of getting the point to the screen.
For these reasons, parallel projection is very easy to do and is good for
modeling where perspective would distort construction, but it is not used as
much as perspective projection. For the rest of this tutorial, assume that we
are dealing with members of our point class that we developed. Notice that our
test object to the right after projection each edge is perfectly aligned just
as it was in the world. Each edge that was parallel in the world appears
parallel in the projection. The
transition from world coordinates to screen coordinates is very simple.
sx = wx+XCenter
sy = -wy+YCenter
Remember that our world is designed to be viewed from the center (0,0,0).
If we just used the world coordinates, our view would be incorrect! This is
because the upper left of the screen is (0,0) and this is NOT aigned with what
we want. To correct this, we must add half the screen width and half the screen
height to our world coordinates so that the views are the same. Also notice
that we are taking -1*wy. By now you should be able to guess why! It is because
in our world, as the object moves up, its y extent increases. This is
completely opposite of our screen where moving down increases its y extent.
Multiplying the y extent by -1 will correct this problem as well! I told you it
was simple!
Perspective
Projection
This type of projection is a little more complicted than parallel
projection, but the results are well worth it. We are able to realistically
display our world as if we were really standing there looking around! The same
display issues face us as before
1. We need to align the screen (0,0) with the world (0,0,0)
2. We need to correct the y directional error.
We correct the two problems as we did before. We add half the screen
width and height to our point, and then reverse the sign of the y extent.
Here's a generalized equation for the actual perspective projection.
OneOverZ= 1/wz;
sx = wx
* XSCALE * OneOverZ + XCenter;
sy = -wy * YSCALE * OneOverZ + YCenter;
sz =
wz;
a) Explain the difference between
orthographic projection and isometric projection with the help of diagrams.
Indicate their applications. [6+3]
Isometric
is a drawing method where horizontal lines are drawn at 30 degree instead,
whilst vertical lines are always vertical. There is no vanishing point.
Orthographic
projections are drawn to a vanishing point while Isometric projections are not
and are also based on a 3 120 degree axis.
b) What
are advantages and disadvantages of homogenous co-ordinates? [4]
hey have the
advantage that the coordinates of a point, even those at infinity, can be
represented using finite coordinates. Often formulas involving homogeneous
coordinates are simpler and more symmetric than their Cartesian counterparts.
Homogeneous coordinates have a range of applications, including computer graphics and 3D computer vision, where they allow affine
transformations and, in
general, projective
transformations to be
easily represented by a matrix.
If the homogeneous
coordinates of a point are multiplied by a non-zero scalar then the resulting
coordinates represent the same point. An additional condition must be added on
the coordinates to ensure that only one set of coordinates corresponds to a
given point, so the number of coordinates required is, in general, one more
than the dimension of the projective space being considered. For example, two
homogeneous coordinates are required to specify a point on the projective line
and three homogeneous coordinates are required to specify a point on the
projective plane.
The computer graphics
pipeline as we have described it made use of homogeneous coordinates when it
came to clipping. The given reason for this was that it avoids a division by
zero problem.
Disadvantages: the main disad has to do with efficiency. First , it takes more space to store 4 tuples and 4x4 matrices than 3 tuples and 3x4 matrices. Second 4x4 matrices need more multiplications and additions to act on a point than 3x4 matrices. Another disad is that homogenous coordinates are less easy tounderstand than Cartesian coordinates.
Disadvantages: the main disad has to do with efficiency. First , it takes more space to store 4 tuples and 4x4 matrices than 3 tuples and 3x4 matrices. Second 4x4 matrices need more multiplications and additions to act on a point than 3x4 matrices. Another disad is that homogenous coordinates are less easy tounderstand than Cartesian coordinates.
Advantages:the adv is
uniformity. The composite of transformations can be dealt with in a more
uniform way and certai hsape manipulations become easier using a homogeneous
matrix for the shape to world coordinate system.
What is the relationship between the translations Ttx,ty , T -tx, -ty and (T tx , ty )-1? [4]
b) What is the relationship between the
rotations Rθ , R-θ and Rθ-1. [4]
Translations and Rotations on the xy-Plane
Then,
the relationship between (x, y) and (x', y') can be put into a
matrix form like the following:
Therefore, if a line has an equation Ax + By + C =
0, after plugging the formulae for x and y, the line has a new
equation Ax' + By' + (-Ah - Bk + C) = 0.
If a point (x, y) is rotated an angle a
about the coordinate origin to become a new point (x', y'), the
relationships can be described as follows:
Thus, rotating a line Ax + By + C = 0 about the
origin a degree brings it to a new equation:
(Acosa
- Bsina)x' + (Asina + Bcosa)y'
+ C = 0
Translations and rotations can be combined into a single
equation like the following:
The above means that rotates the point (x,y)
an angle a about the coordinate origin and translates the rotated result
in the direction of (h,k). However, if translation (h,k)
is applied first followed by a rotation of angle a (about the coordinate
origin), we will have the following:
Therefore, rotation and translation are not commutative!
In the above discussion, we always present two matrices, A
and B, one for transforming x to x' (i.e., x'=Ax)
and the other for transforming x' to x (i.e., x=Bx').
You can verify that the product of A and B is the identity
matrix. In other words, A and B are inverse matrices of each
other. Therefore, if we know one of them, the other is the inverse of the given
one. For example, if you know A that transforms x to x',
the matrix that transforms x' back to x is the inverse of A.
Let R be a transformation matrix sending x'
to x: x=Rx'. Plugging this equation of x into a
conic equation gives the following:
Rearranging terms yields
This is the new equation of the given conic after the
specified transformation. Note that the new 3-by-3 symmetric matrix that
represents the conic in a new position is the following:
Now you see the power of matrices in describing the
concept of transformation.
Translations and Rotations in Space
Translations
in space is similar to the plane version:
The above translates points by adding a vector <p,
q, r>.
Rotations in space are more complex, because we can
either rotate about the x-axis, the y-axis or the z-axis.
When rotating about the z-axis, only coordinates of x and y
will change and the z-coordinate will be the same. In effect, it is
exactly a rotation about the origin in the xy-plane. Therefore, the
rotation equation is
With this set of equations, letting a be 90 degree
rotates (1,0,0) to (0,1,0) and (0,1,0) to (-1,0,0). Therefore, the x-axis
rotates to the y-axis and the y-axis rotates to the negative
direction of the original x-axis. This is the effect of rotating about
the z-axis 90 degree.
Based on the same idea, rotating about the x-axis
an angle a is the following:
Let us verify the above again with a being 90
degree. This rotates (0,1,0) to (0,0,1) and (0,0,1) to (0,-1,0). Thus, the y-axis
rotates to the z-axis and the z-axis rotates to the negative
direction of the original y-axis.
But, rotating about the y-axis is
different! It
is because the way of measuring angles. In a right-handed system, if your right
hand holds a coordinate axis with your thumb pointing in the positive
direction, your other four fingers give the positive direction of angle
measuring. More precisely, the positive direction for measuring angles is from
the z-axis to x-axis. However, traditionally the angle measure is
from the x-axis to the z-axis. As a result, rotating an angle a
about the y-axis in the sense of a right-handed system is equivalent to
rotating an angle -a measuring from the x-axis to the z-axis.
Therefore, the rotation equations are
Let us verify the above with rotating about the y-axis
90 degree. This rotates (1,0,0) to (0,0,-1) and (0,0,1) to (1,0,0). Therefore,
the x-axis rotates to the negative direction of the z-axis and
the z-axis rotates to the original x-axis.
A rotation matrix and a translation matrix can be
combined into a single matrix as follows, where the r's in the
upper-left 3-by-3 matrix form a rotation and p, q and r
form a translation vector. This matrix represents rotations followed by a
translation.
You can apply this transformation to a plane and a
quadric surface just as what we did for lines and conics earlier.

b) Describe
the Sutherland-Cohen algorithm for clipping? Is this applicable to any type of
window? Justify your answer. [9]
The
more efficient Cohen-Sutherland Algorithm performs initial tests on a line to
determine whether intersection calculations can be avoided.
1.
End-points pairs
are check for trivial acceptance or trivial rejected using the outcode.
2. If
not trivial-accepance or trivial-rejected, divided into two segments at a clip
edge.
3. Iteratively
clipped by testing trivial-acceptance or trivial-rejected, and divided into two
segments until completely inside or trivial-rejected.
Pseudo-code of Cohen-Sutherland
Algorithm.
To
perform trivial accept and reject tests, we extend the edges of the clip
rectangle to divide the plane of the clip rectangle into nine regions. Each
region is assigned a 4-bit code deteermined by where the region lies with
respect to the outside halfplanes of the clip-rectangle edges. Each bit in the
outcode is set to either 1 (true) or 0 (false); the 4 bits in the code
correspond to the following conditions:
o Bit
1 : outside halfplane of top edge, above top edge
Y > Ymax
Y > Ymax
o Bit
2 : outside halfplane of bottom edge, below bottom edge
Y < Ymin
Y < Ymin
o Bit
3 : outside halfplane of right edge, to the right of right edge
X > Xmax
X > Xmax
o Bit
4 : outside halfplane of left edge, to the left of left edge
X < Xmin
X < Xmin
In
summary, the C-S algorithm is efficient when outcode testing can be done
cheaply (for example, by doing bitwise operations in assembly language) and
trivial acceptance or rejection is applicable to the majority of line segments
.(For example, large windows - everything is inside , or small windows - everything is outside).
3.b) Explain
the steps of the Cyrus-Beck line-clipping algorithm. [6]
The Cyrus–Beck algorithm is a line clipping algorithm. It was designed to be more efficient than the Sutherland–Cohen algorithm which uses repetitive clipping [1]. Cyrus–Beck is a general algorithm and can be used with a convex polygon clipping window unlike Sutherland-Cohen that can be used only on a rectangular clipping area
Here the parametric equation of a line in the view plane is:
P(t) = P(0) + t(P1 − P0)
where t = 0 at P(1) t = o at t0
Now to find intersection point with the clipping window we calculate value of dot product
n(Pt-f)
{if > 0
vector pointed toward interior
if = 0 vector
pointed parallel to plane containing f
if < 0 vector
pointed away from interior
here n stands for normal.
By this we select the point of intersection of line and clipping window where (dot product = 0 ) and hence clip the line
c) Why
clipping Is an Important operation for rendering? [4]
Volume
clipping is an important operation that helps the understanding of 3d
volumetric data. Clipping helps to uncover important details in the data by
cutting away selected parts of the volume based on the position of clip
geometry. The simplest clip geometries are one or more clipping planes that
reveal slices and corss sections of the volume data. Cropping is an easy way
of specifying a rectilinear region of
interest with multiple clipping planes parallel to the volume faces. During
cropping, cross sections of the volume may be combined by taking intersection,
unions and inverses to define elaborate regions of visibility of the volume
dataset. In its most general form, volume cliplling uses arbitrary clip
geometry that may be defines by a polygon mesh or by an additional volume.
b) Is it necessary to compute lighting
information before clipping for rendering a 3D scene? Explain. [6]
Geometry in the complete 3D scene is
lit according to the defined locations of light sources and reflectance and
other surface properties. Current hardware implementations of the graphics
pipeline compute lighting only at the vertices of the polygons being rendered.
The lighting values between vertices are then interpolated during
rasterization. Per-fragment (i.e. per-pixel) lighting can be done on modern
graphics hardware as a post-rasterization process by means of a shader program.
.Outline
the steps required to generate a hidden-surface image using the depth-buffer
approach and then comment on the relative merits of this approach compared with
the scan-line algorithm. [18]
Comparison of Visibility Algorithms
ray casting:
memory: used for object database
implementation: easy, but to make
it fast you need spatial data structures
speed: slow if many objects: cost
is O((#pixels)´(#objects))
generality: excellent, can even do
CSG (constructive solid geometry), shadows, transp.
painter’s:
memory: used for image buffer
implementation: moderate, requires
scan conversion; hard if sorting & splitting needed
speed: fast if objects can be
sorted a priori, otherwise sorting many objs. can be costly
generality: splitting of
intersecting objects & sorting make it clumsy for general 3-D rendering
z-buffer:
memory: used for image buffer &
z-buffer
implementation: moderate, requires
scan conversion. It can be put in hardware.
speed: fast, unless depth
complexity is high (redundant shading)
generality: very good
others (scanline, object space): tend to be hard to implement, and
very hard to generalize to non-polygon models
c) Describe
the features of Depths sort algorithm. [6]
It is one solution to the visibility problem, which is the problem of deciding which elements of a rendered scene are visible, and which are hidden. The painter's algorithm is another common solution which, though less efficient, can also handle non-opaque scene elements. Z-buffering is also known as depth buffering.
Algorithm:
• Sort the polygons in
the scene by their depth
• Draw them back to
front
• Problem:
Unless all polygons have constant z, a strict depth ordering may not exist
Note: Constant z case is
important in VLSI design
Depth Sort (Painter
Algorithm)
• General Case:
Given two polygons P and Q, an order may be determined between them, if at
least
one of the following
holds:
1) z values of P and Q
do not overlap 2) The bounding rectangle in the x, y plane for P and Q do not
overlap
3) P is totally on one
side of Q’s plane 4) Q is totally on one
side of P’s plane 5) The bounding rectangles of Q and P
do not intersect in the
projection plane

• If all the above
conditions do not hold, P and Q may be split along intersection edge
into two smaller
polygons
As
was mentioned before, the painter's algorithm is a simplified version of the
depth-sort algorithm. In the depth-sort algorithm, there are 3 steps that are
performed:
Step 1:Sort objects from near to far (smallest to
largest z coordinate).
Step 2:Resolve ambiguities, rearranging the object list and splitting faces as necessary.
Step 3:Render each face on the rearranged list in ascending order of smallest z coordinate (from back to front).
Step 2:Resolve ambiguities, rearranging the object list and splitting faces as necessary.
Step 3:Render each face on the rearranged list in ascending order of smallest z coordinate (from back to front).
Resolving
ambiguities in Step 2 is what replaces simple rendering of the whole face of
the object. Let the object farthest away be called P. Before this object is
rendered, it must be tested against other objects which we will call Q, where
the z extent of q overlaps the z extent of P. This is done to prove that P
cannot obscure Q and that P can therefore be written before Q. Up to 5 tests
are performed, in order of increasing complexity (Taken from Foley, Van Dam,
Feiner, Hughes, Phillips. Introduction to Computer Graphics Addison-Wesley, New
York, c.1994):
1.
Do the polygons' x extents not overlap?
2. Do the polygons' y extents not overlap?
3. Is P entirely on the opposite side of Q's plane from the viewpoint?
4. Is Q entirely on the same side of P's plane as the viewpoint?
5. Do the projections of the polygons onto the (x,y) plane not overlap? (This can be determined by comparing the edges of one object to the edges of another).
If
all 5 tests fail, the assumption is that P obscures Q. So we test whether Q
could be rendered before P. Tests 3 and 4 are performed again, with the
polygons reversed:
3'.
Is Q entirely on the opposite side of P's plane from the viewpoint?
4'. Is P entirely on the same side of Q's plane as the viewpoint?
4'. Is P entirely on the same side of Q's plane as the viewpoint?
The
next picture is a top down view, relative to th eviewpoint, of objects P and Q.

The next picture is a front view. The tests are inconclusive: The objects intersect each other.

No
matter which is P or Q, there is no order in which P and Q could be rendered
correctly. Instead, either P or Q must be split by the plane of the other. The
original unsplit object is discarded, its pieces are inserted in the list in
proper order, and the algorithm proceeds as before. The following picture shows
an example of splitting: (taken from http://www.cs.unc.edu/~stewart/comp236/hidden-surface2.html)

The
next picture shows a more subtle case: it is possible to move each object to
the end of the list to place in the correct order relative to one, but not
both, of the other objects.
This
would result in an infinite loop. To avoid looping, the object that moves to
the end of the list are marked. If the first 5 tests fail and the current Q is
marked, tests 3' and 4' are not performed. Instead, one of the objects is
split, as if tests 3' and 4' had both failed, and the pieces are reinserted
into the list.
a) Explain the Z-buffer algorithm for
removing hidden surfaces. [9]
The
basic idea is to test the z - depth of each surface to determine the closest
(visible) surface. Declare an array z buffer(x, y) with one entry for each
pixel position. Initialize the array to the maximum depth. Note: if have
performed a perspective depth transformation then all z values 0.0 <= z (x,
y) <="1.0". So initialize all values to 1.0. Then the algorithm is
as follows:
for
each polygon P
for each pixel (x, y) in P
compute z_depth at x, y
if z_depth < z_buffer (x, y) then
set_pixel (x, y, color)
z_buffer (x, y) <= z_depth
The
polyscan procedure can easily be modified to add the z-buffer test. The
computation of the z_depth (x, y) is done using coherence calculations similar
to the x-intersection calculations. It is actually a bi-linear interpolation,
i.e., interpolation both down (y) and across (x) scan lines.
Advantages
of z-buffer algorithm: It always works and is simple to implement.
Disadvantages:
- May paint the
same pixel several times and computing the color of a pixel may be
expensive. So might compute the color only if it passes the z_buffer test.
Might sort the polygons and scan front to back (reverse of painter's
algorithm) - this still tests all the polygons but avoids the expense of
computing the intensity and writing it to the frame buffer.
- Large memory
requirements: if used real (4 bytes) then for 640 x 480 resolution:
4bytes/pixel = 1,228,000 bytes. We usually use a 24-bit z-buffer so
900,000 bytes or 16 - bit z-buffer = 614,000 bytes. Note: For VGA mode 19
(320 x 200 and only use 240 x 200) then need only 96,000 bytes for a
16-bit z_buffer. However, may need additional z - buffers for special
effects, e.g. shadows.
Alternative
method for computing z depth values using plane equations.
- Perform a
perspective depth transformation (to maintain planes).
- Compute plane
equations (not the same as before the perspective transformation)
- For each pixel
in PDC (xp, yp) find the x , y wdc values (using an inverse point
transform)
- Put x, y into
plane equation to find z in wdc
- Perform z buffer test on z.
b) What
do you mean by hidden lines and surfaces? Describe area subdivision method for
removing hidden surfaces.
[12]
Area Subdivision Algorithms
The area-subdivision method takes
advantage of area coherence in a scene by locating those view
areas that represent part of a
single surface.
The total viewing area is
successively divided into smaller and smaller rectangles until each small
area is simple, ie. it is a single
pixel, or is covered wholly by a part of a single visible surface or no
surface at all.
The procedure to determine whether
we should subdivide an area into smaller rectangle is:
1. We first classify each of the
surfaces, according to their relations with the area:
Surrounding surface - a single
surface completely encloses the area
Overlapping surface - a single
surface that is partly inside and partly outside the area
Inside surface - a single surface
that is completely inside the area
Outside surface - a single surface
that is completely outside the area.
To improve the speed of
classification, we can make use of the bounding rectangles of surfaces for
early confirmation or rejection
that the surfaces should be belong to that type.
2. Check the result from 1., that,
if any of the following condition is true, then, no subdivision of this
area is needed.
a. All surfaces are outside the
area.
b. Only one surface is inside,
overlapping or surrounding surface is in the area.
c. A surrounding surface obscures
all other surfaces within the area boundaries.
For cases b and c, the color of the
area can be determined from that single surface.

No comments:
Post a Comment
Note: Only a member of this blog may post a comment.